Good morning, welcome back
Here's what's new this month
Product update
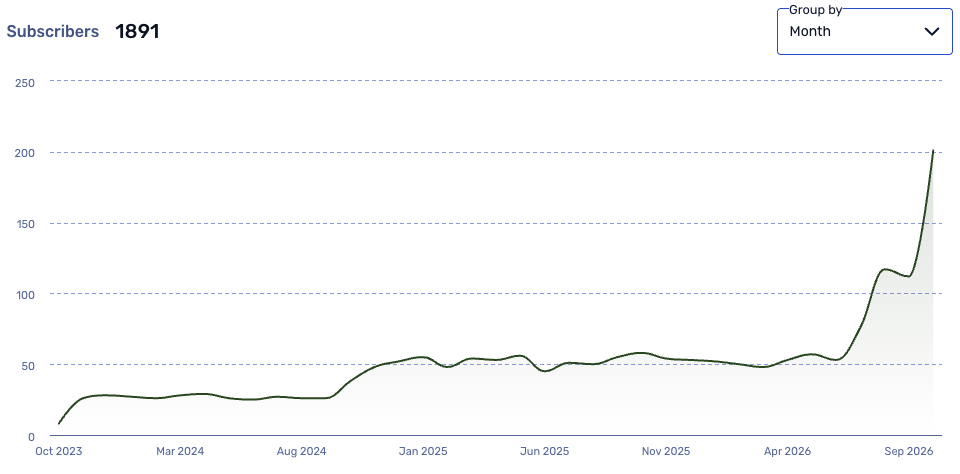
Spot trends across subscribers and viewers
Group subscriber and viewer statistics by day, week, month or year to see how your results change over time. Use the trend graph across your account or within a selected webinar, episode or broadcast, and hover over each period for exact totals. This makes the impact of your changes easier to compare.
Read more